5 min read
How to use Google Trends, and what it can't tell you
Five steps to read a Google Trends chart properly, the mistake most people make with the 0 to 100 scale, and what to check next.

Contents
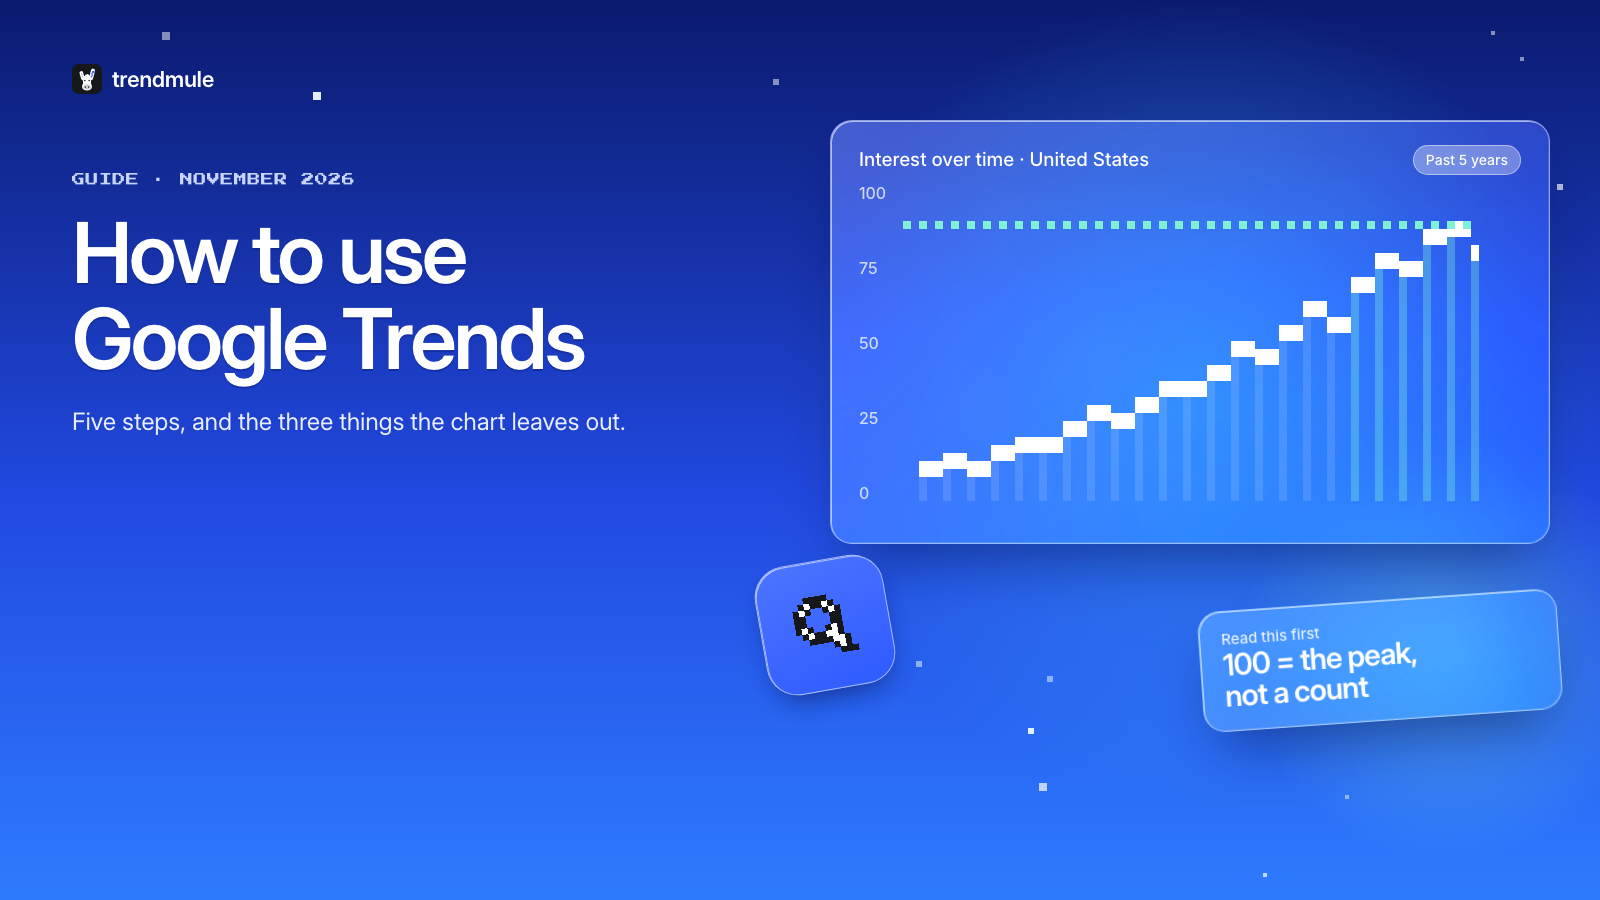
Google Trends is a free Google tool that shows how interest in a search changes over time and by place, on a scale from 0 to 100. To use it, enter a search term, pick a country and a time range, then read the line: 100 is the term's highest point in that view, not a number of searches. Google says each data point is divided by all searches in that place and time, then scaled from 0 to 100 (Google Trends Help).
That makes Google Trends good at one question, which way interest is moving, and silent on how big a search is or what it's worth.
How do you use Google Trends step by step?
- Open Google Trends and type a term. Pick the topic version (it says "Topic" under it) when you want every way people search for a subject, or the plain term for that exact phrase.
- Set the country. Worldwide data mixes very different markets. A product rising in the US can be flat in the UK.
- Set the time range to at least 12 months, better five years. A 7-day view makes every bump look like a trend.
- Add comparison terms. Put several terms on one chart to see which is bigger relative to the others, on the same scale.
- Scroll to related queries and switch to Rising. These are searches that grew most compared with the previous period. "Breakout" means a search grew by more than 5,000% (Google Trends Help).
Repeat with the "Interest by subregion" map if you sell or publish locally.
How do you read the Google Trends 0 to 100 scale?
100 is the peak of that chart, and every other point is a share of it. A value of 50 means interest was half as high as at the peak, in that place and time range. Change the country, the dates or the comparison terms, and the whole line rescales.
This is the most common mistake: reading a high number as a big search. A small search that just peaked shows 100, while a huge search at a quiet moment shows 40. Two charts made separately can't be compared at all, because each one is scaled to its own peak.
Our explainer on whether Google Trends shows search volume covers how to get real numbers.
What does Google Trends not tell you?
Google Trends answers "which way is it moving". Three questions you need for a decision are left out:
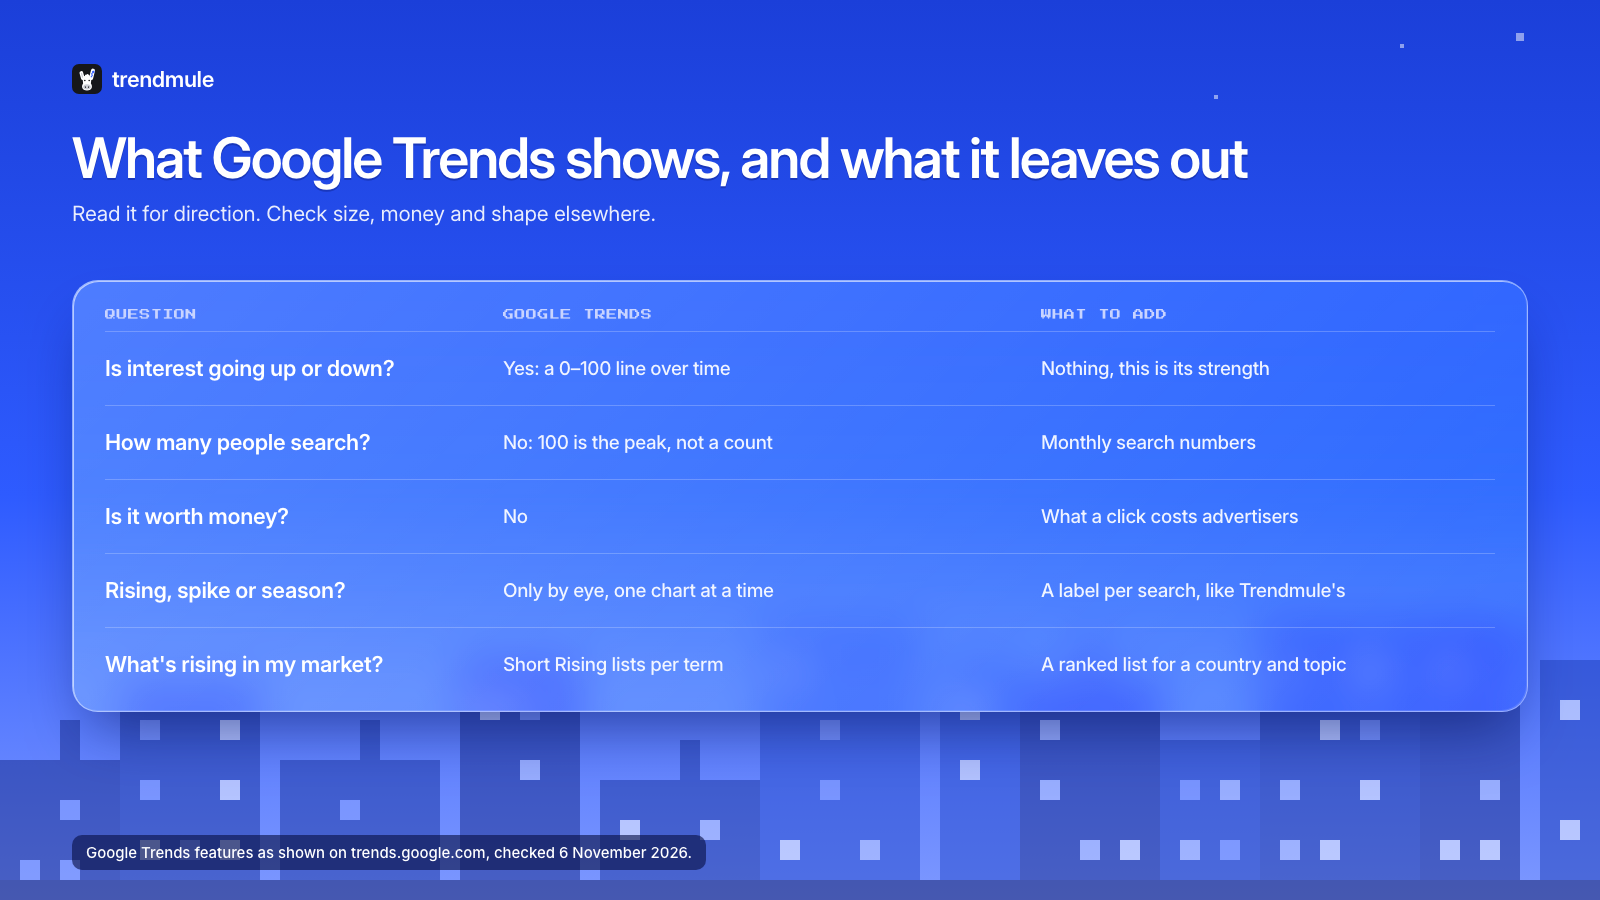
- How many people search. The chart is relative, so a line going up could be 100 searches or 100,000.
- Whether it's worth money. There's no click cost, so you can't tell a search people buy from a search people only read about.
- Whether a rise is a trend, a spike or a season. You can see it by eye, one chart at a time, but nothing labels it for you.
That last one is where most time goes. In Trendmule's US Google search data for August to October 2026, heated blanket searches rose 118% between the summer and the autumn, which looks like a trend in a 90-day view. Over two years, it's the same rise as every winter, within 5% of last year's level. Our guide on how to read search trends shows the four shapes to look for.
Is a rising line in Google Trends a trend?
Not always. A rising line is a trend only if it rises above last year's level, not just above last month's. Compare the same months across years with a five-year view. If the line climbs every October and falls every January, it's a season.
Two examples from the same US data:
- Walking pad: up 157% on a year earlier, and October 2026 its biggest month in three years of data. That's a trend.
- Candle warmer lamp: it climbs every autumn, so the rise alone means little. But October 2026 was double October 2025, so this season is bigger than the last. That's a season with growing demand underneath.
How does Trendmule work alongside Google Trends?
Trendmule is a dashboard of rising Google searches for creators and app makers. Where Google Trends needs a term to start, Trendmule starts from a country and a topic and lists the searches gaining speed there. Each search comes with its volume, its growth and a label that says whether it's still climbing, holding, seasonal or fading, so you don't read every chart by eye.
Many people keep both: Trendmule to find what's rising, Google Trends to look at one term in detail. Our page on Google Trends alternatives compares the options.
What are the limits of Google Trends data?
- It's a sample. Google says Trends uses a sample of searches, which is why small terms show zeros or jumpy lines.
- It rescales every time. Change one setting and every number changes, so screenshots from different days don't line up.
- Low-volume terms disappear. Terms with too few searches show no data, which hides exactly the early, small searches that are about to grow.
Whether that matters depends on your question: checking one big term, Google Trends is enough; scanning a niche for what's new, it's slow.
Questions people ask
Is Google Trends free?
Yes. Google Trends is free and works without an account at trends.google.com.
What does 100 mean in Google Trends?
100 is the highest point of interest in the chart you're looking at, for that place and time range. It's a relative score, not a number of searches.
What does Breakout mean in Google Trends?
Breakout means a related search grew by more than 5,000% compared with the previous period, according to Google Trends Help.
How accurate is Google Trends?
It's accurate for direction on bigger searches. It uses a sample of searches, so small terms can show zeros or jumpy lines, and it never shows search counts.